| 일 | 월 | 화 | 수 | 목 | 금 | 토 |
|---|---|---|---|---|---|---|
| 1 | 2 | 3 | ||||
| 4 | 5 | 6 | 7 | 8 | 9 | 10 |
| 11 | 12 | 13 | 14 | 15 | 16 | 17 |
| 18 | 19 | 20 | 21 | 22 | 23 | 24 |
| 25 | 26 | 27 | 28 | 29 | 30 | 31 |
- PYTHON
- ChIPseq
- CSS
- Batch effect
- DataFrame
- pandas
- 싱글셀 분석
- HTML
- Git
- cellranger
- javascript
- julia
- matplotlib
- single cell
- single cell rnaseq
- python matplotlib
- 비타민 C
- EdgeR
- drug muggers
- Bioinformatics
- scRNAseq
- CUTandRUN
- ngs
- github
- drug development
- single cell analysis
- scRNAseq analysis
- js
- MACS2
- CUT&RUN
- Today
- Total
목록ChIPseq (5)
바이오 대표
 [ Deeptools ] DBS(differential binding sites) 를 Deeptools의 ComputeMatrix와 plotHeatmap을 이용해서 시각화하기
DBA (Differential Binding sites) visualization Chipseq 이나 Cut&Run, Cut&Tag 기술을 이용해서, target antibody가 붙는 sequence 정보를 얻을 수 있고 어느 지역에 더 많이 붙는지 DBA(differential binding sites analysis) 분석을 할 수 있다. 해당 글에서는 DBA(differential binding analysis) 로 확인된 지역을 Deeptools 의 computeMatrix 와 plotHeapmap을 이용하여 시각화 할 것이다. Step 1. bigWigMerge (ucsc-bigwigmerge v377) multiple bigWigs → A single Bedgraph file bigWigM..
HOMER 을 이용해서 Peak annotation 하는 방법 HOMER v4.11 annotatePeaks.pl > BED 파일 이나 HOMER peak files BED files 는 최소 6개의 칼럼으로 구성되어야 한다고 하지만 column 4 개(chr, start, end, strand) 도 허용한다. Column1: chromosome Column2: starting position Column3: ending position Column4: Unique Peak ID Column5: not used Column6: Strand (+/- or 0/1, where 0="+", 1="-") HOMER peak files (TAB으로 분리되는 txt files 형식) Column1: Unique P..
 [ Cut & Tag / Cut & Run ] Cut & Tag 투토리얼
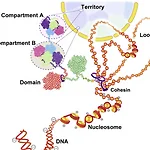
해당 글을 https://yezhengstat.github.io/CUTTag_tutorial/#Cite_this_tutorial 을 참고하였습니다. CUT & TAG Data Processing and Analysis Tutorial 1. Introduction Eukaryotic nucleus DNA에서 일어나는 모든 dynamic process 는 chromatin landscape/지형 을 따른다고 보면된다. Chromatin landscape 는 nucleosomes, their modification, TF and chromatin-associated complexed 등으로 이루어져있다. 이렇게 다는 chromatin features 을 이용하면 다른 cell type간, development..
 [MACS2] Peak calling with MACS2
MACS2(Model-based Analysis of ChiP-seq) for ChIP-seq or ATAC-seq Peak Calling = Chip-seq 실험에서 enriched aligned reads, genome area 를 찾는 것이다. Chip-seq에서 나온 alignment files (SAM/BAM) 에서 sense(+) strand와 antisense(-) strand 에서의 read densities 가 다름을 확인할 수 있다. 5' ends를 통해 +/- strand를 구분할 수 있다. 통계학을 이용해 각 그룹들의 distribution을 평가하고, background와 비교하여 해당 enrichment site 가 정말 binding site 인지 확인할 수 있다. peak c..