| 일 | 월 | 화 | 수 | 목 | 금 | 토 |
|---|---|---|---|---|---|---|
| 1 | 2 | 3 | 4 | 5 | 6 | |
| 7 | 8 | 9 | 10 | 11 | 12 | 13 |
| 14 | 15 | 16 | 17 | 18 | 19 | 20 |
| 21 | 22 | 23 | 24 | 25 | 26 | 27 |
| 28 | 29 | 30 | 31 |
- 비타민 C
- CSS
- single cell
- Git
- CUTandRUN
- Bioinformatics
- DataFrame
- single cell rnaseq
- ngs
- python matplotlib
- drug development
- ChIPseq
- pandas
- cellranger
- PYTHON
- Batch effect
- julia
- EdgeR
- CUT&RUN
- drug muggers
- single cell analysis
- js
- javascript
- scRNAseq analysis
- scRNAseq
- MACS2
- 싱글셀 분석
- github
- matplotlib
- HTML
- Today
- Total
바이오 대표
[싱글셀 논문] Background/Ambient RNA 제거 툴 비교 (SoupX, DecontX, Cellbender) “The effect of background noise and its removal on the analysis of single-cell expression data” 2023 본문
[싱글셀 논문] Background/Ambient RNA 제거 툴 비교 (SoupX, DecontX, Cellbender) “The effect of background noise and its removal on the analysis of single-cell expression data” 2023
바이오 대표 2023. 7. 10. 07:19요약
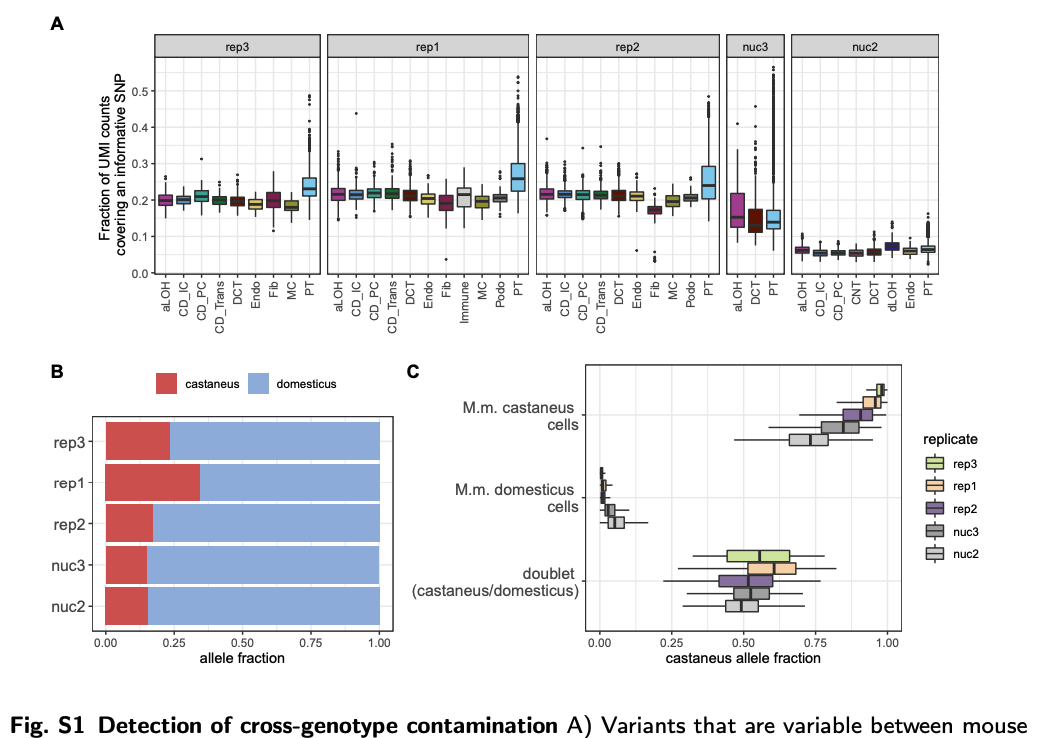
2개의 다른 subspecies mice (M.m.castaneus 와 M.m.domesticus) 를 이용하여서 background noise 실험을 진행하였다. 사용된 Mice들은 imbred(근친계) 임으로 99% 유전자가 동일하고 homozygous SNP을 이용해서 ~7000 유전자의 subspecies를 구별해 낼 수 있다. 즉, SNP을 이용하여 cell 의 endogenous, exogenous UMI 가 구별이 되고 이를 이용해서 background noise를 계산할 수 있다는 뜻이다. 논문 실험에서는 총 5개의 replicate (3 scRNAseq, 2 snRNAseq)에서 background noise를 계산하였고, 꽤 variability 가 큰 noise 값을 보였다 (3-35% of the total UMIs/cell). 그리고 background noise (Ambient RNA) 가 증가할 수록, marker을 찾는 능력치가 떨어지고, specificity가 떨어지는 것을 확인 할 수 있었다. 하지만 backgound 값이 크더라도 실제 clustering 이나, classification 을 하는 부분에서는 여전히 robust한 현상을 확인하였다.
해당 background noise를 없애기 위해 가장 많이 사용 되는 3개의 툴을 이용하여 실험하였고 비교하였다. [1] SoupX [2] DecontX [3] Cellbender. 논문에서는 cell bender 이 모든 replicate에서 가장 믿을만한 결과값을 준다고 한다. 하지만 computationally DecontX 와 SoupX가 몇초에서 몇분 걸리는 반면 cellbender는 ~ 45 CPU hours 가 걸린다. (물론 core, cpu 갯수를 늘린순 있지만) 해당 툴들 비교는 글 마지막 부분에 추가설명하였습니다.
Q) 아직 해당 논문에서 구한 background noise 방식 (genotype based)이 실제 Ambient RNA을 예측할 수 있는지 의심이 든다. 왜냐하면, 같은 cell type이라고 하더라도, 죽어가는 unhappy 세포들에게서 나온 cell-free RNA나, lysis할때 생긴 RNA 와 같은 아이들은 같은 subspecie mouse cell에서도 나온다고 생각하기 때문이다.
Background noise (contaminating reads) 정의
- cell-free “ambient” RNA : 죽어가는 unhappy 세포가 suspension에 흘러 나온 경우
- Barcode swapping: library preparation 과정에서, 실수로 생기는 RNAs들 - 하지만 경우가 별로 없어서 크게 상관 안써도 될듯하다
- incompletely expected PCR projects, un-removed oligo nucleotides (droplet method에서 beads에 붙어있는 oligo nucleotide만 복제한 경우 cell, UMI 는 카운트 될테니) - 하지만 최소 UMI/cell filtering에서 걸러질 수 있다.
내용
Background noise의 대부분은 Ambient RNA 로 인해 생긴다. 근거 1) Contamination profile 자체가 ambient RNA profile과 유사하다. Figure 3 을 참고하면, B,F - empty droplet과 contaminated droplet의 UMI counts/ profile과 fraction of intronic variants가 유사한 것을 확인 할 수 있다. 그리고 논문의 실험에서의 background noise는 genotype 으로 endogenous, exogenous RNA를 구별해낼 수 있는데, Figure S1. C를 근거로, background noise를 genotype으로 거짓 구별해낼 수 있다는 것을 보여준다. 해당 genotype을 기반으로 계산된 데이터를 ground truth 라고 설정하고 세가지 툴 SoupX, DecontX, Cellbender을 이용해서 correct count 를 계산했을 때의 성능을 Figure 5, 6 에서 확인 할 수 있다.
결과: Cellbender가 모든 Replicate 에서 평균적으로 나은 Robust 결과를 보여준다 라고 하지만, 정정하고싶다. Figure 5는 얼마나 정확히 background noise를 예측했는지에 대한 성능을 보여준다. Background 값을 알면 (empty droplet이용) SoupX나 DecontX이 Cellbener보다 좋은 결과를 보일 때도 있다. 또한 snRNAseq 에서는 Cellbender가 크게 성공해 보이지는 못한다. 그래도, Figure 6에서 background를 제거한 후 downstream analysis에서는 크게 차이가 나지 않지만 꽤 robust한 결과를 보인다.


Tool 비교
SoupX
해당 패키지는 unfiltered barcode-feature matrix 와 filtered barcode-feature matrix 2개의 매트릭스를 이용한다. 먼저 두개의 차이를 이용해서 empty droplet 정보를 얻고, 해당 empty droplets에서의 ambient mRNA expression profile을 계산한다. 그리고 각 셀마다의 contamination fraction (fraction of UMIs originating from the background 즉 총 UMI counts 중에서 ambient mRNA의 UMI counts fraction) 을 계산하거나, manually 정한다. 마지막으로 empty droplet에서 구한 ambient mRNA expression profile 과 contamination fraction 값을 이용해서 각 세포의 expression 수치를 수정해준다.
Limitation: contamination fraction을 biological 지식으로 알면 좋지만, 그렇지 않을 경우 auto estimated fraction을 이용하는데 정확도가 보다 떨어진다.
DecontX
DecontX는 Bayesian 방법을 이용해서 각 세포의 contamination 을 예측하고 제거한다. 모든 세포에 contamination이 존재하고 우리가 보는 observed expression은 2개의 multinomial distributions으로 이루어져있다고 추측한다. (1) 세포 실제 native transcript counts distribution (2) 모든 세포들의 contamination counts distribution. 여기서 contamination distribution 은 all other cell population distribution의 weighted combination이라고 정의한다. 이를 이용해 실제 transcript counts 를 추출해 내어 further downstream analysis 를 진행 할 수 있다. 여기도 background distribution을 알면 더 정확한 값을 계산해준다.
Limitation: 처음에 계산할때, 주어진 clustering 의 정확도에 Heavily dependent
CellBender
특정 tissue 타입에 따라 Ambient RNA 혹은 high background counts가 일어나는 정도가 다른데(Madisson et al), 특히 Single cell nuclei sample에서는 좀 더 많은 background 경향을 보인다. 왜냐하면 nuclei를 뽑아 낼때, cytoplasmic RNA가 solution에 흘러들어올 수 있기 때문이다. Background가 크기 때문에 barcode rank plot을 확인해보면, steep cliff (뚝 떨어지는) 을 확인할 수 없다.
CellBender Algorithm: remove-background algorithm (Fleming et al.): “Unsupervised removal of systematic background noise from droplet-based single-cell experiments using CellBender”
Method
feature matrix C_ng (n:celll index, g:gene index)
C_ng = [1] true biological counts + [2] background noise counts (following Poisson distribution)

The ambient rate is determined by a learnable ambient profile X(a_g), droplet size factor d(drop_n), and droplet-specific capture efficiency factor E_n.


